


Rotor Flux Monitoring
MC-monitoring is proud to announce a new feature to our CMS-500P Condition Monitoring Software for Rotor Flux Monitoring: the Pole Polar Plot. This advanced visualization tool enhances the analysis of magnetic flux distribution in salient pole synchronous machines, providing operators with faster, clearer, and more flexible diagnostic insights.
Visualize magnetic flux anomalies at a glance
In salient pole machines such as hydrogenerators and synchronous motors, ensuring balanced magnetic flux across all rotor poles is crucial to avoid electrical and mechanical stresses. Local deviations in flux amplitude may reveal underlying issues such as:
- Shorted rotor turns
- Field current unbalance
- Pole degradation
- Rotor eccentricity impacting flux distribution
While traditional magnetic flux analysis focuses on raw flux values (Pole Profile) and absolute flux values computed from the maximum amplitude (Pole Signature), minor but critical deviations can remain unnoticed without dedicated visualization tools.
The new Pole Polar Plot view addresses this challenge by offering an intuitive, rotor-shaped visual representation of flux density variations — enabling faster and more precise diagnostics.
A flexible and comprehensive diagnostic tool
The Pole Polar Plot view is designed to give operators maximum visual flexibility. It allows users to analyze flux deviation based on several different calculation algorithms:
- Average flux amplitude
- Adjacent pole comparison
- Absolute flux values
- Raw flux values
- ...
This feature simplifies fault diagnosis by providing clear indicators when specific poles deviate beyond defined limits, highlighting potential anomalies such as shorted turns.
Exemple - Pole Polar Plot (Average flux amplitude)

The left-hand plot displays each pole measured by the MFT-100 sensor, expressed in Tesla, over one acquisition cycle. Each peak in the waveform corresponds to the magnetic flux generated by an individual rotor pole as it passes in front of the sensor.
On the right-hand side, the Pole Polar Plot provides a circular visualization of the flux amplitude distribution around the rotor. For each pole, the radial distance represents the absolute or relative pole’s flux amplitude depending on the selected algorithm.
The circle at 100% corresponds to the average flux amplitude across all poles. The configurable Upper Alert and Lower Alert thresholds (here set at 103% and 97%) define the acceptable deviation limits.
The parameter Turns per pole (here set to 46) refers to the number of turns in each pole’s excitation winding. This reference helps estimate the potential impact of flux deviations in case of shorted turns.
In this example, all pole amplitudes are within the specified limits, indicating a balanced magnetic flux distribution and no detected anomalies.
Exemple - Detection of a Shorted Rotor Turn
In the following real-case example, the CMS-500P software clearly identified an abnormal magnetic flux condition indicating a potential shorted turn on the rotor.
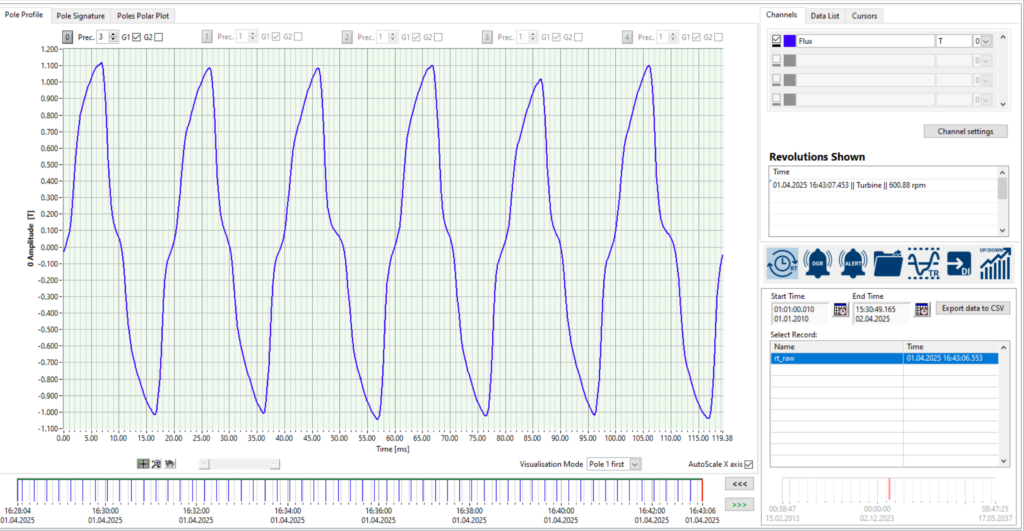
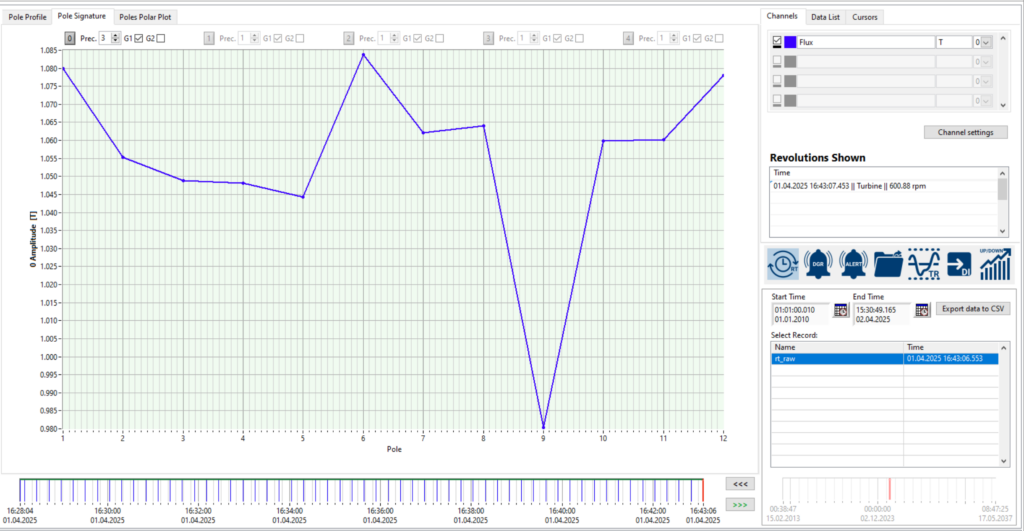
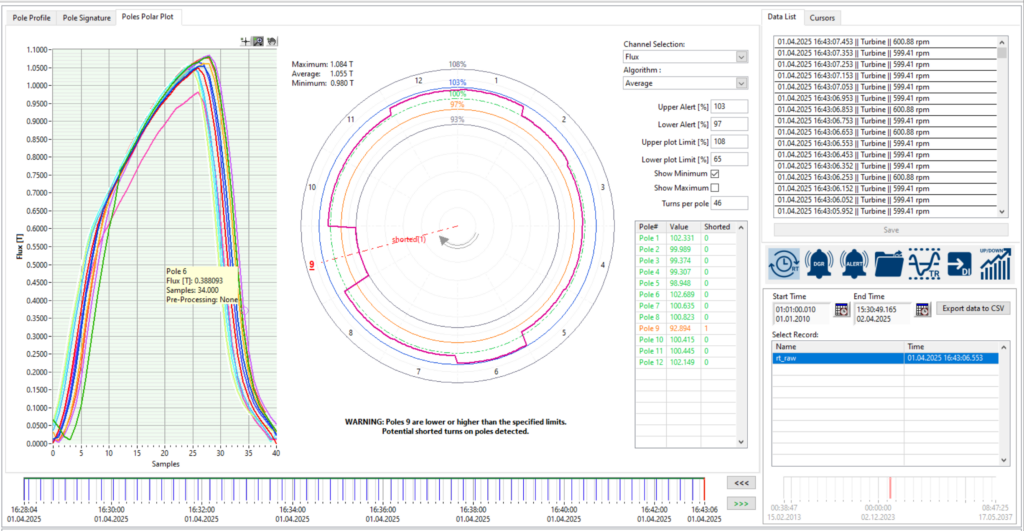
The Pole Polar Plot provides an intuitive visualization of flux amplitude distribution around the rotor.
Here, Pole 9 is visibly below the configured lower alert threshold (97% of average flux amplitude), confirming a significant flux deficit.
The software automatically triggers a warning and annotates the anomaly with the message: "WARNING: Poles 9 are lower or higher than the specified limits. Potential shorted turns on poles detected."
Combine flux analysis with mechanical and thermal indicators
The Pole Flux Deviation view is part of a broader diagnostic toolkit available in the CMS-500P platform.
Operators can easily correlate magnetic flux anomalies with other condition monitoring data, including:
- Air Gap Monitoring (AGT sensors)
- Rotor Temperature Monitoring (RTM sensors)
This cross-analysis capability enables a more accurate diagnosis by linking flux imbalance with potential mechanical or thermal root causes, providing a complete picture of machine condition.
Benefits for asset operators
With the addition of Pole Flux Deviation analysis, CMS-500P users can now:
- Detect incipient electrical or mechanical anomalies at an early stage
- Simplify flux monitoring and diagnostic interpretation
- Make faster, data-driven maintenance decisions
- Minimize unexpected outages and improve machine availability
- Eliminate the need for rotor removal or drop testing to assess rotor condition
Contact our team to learn more about this new feature and request a demonstration tailored to your application.
LET'S KEEP IN TOUCH
Sign up to receive our newsletters